The Experiment
Overview
A time series from 1 hour to 9 hours post-fertilization (hpf) was collected for RNA-seq by students of the MBL Embryology Course to understand the shifts in gene expression occuring in the early embryo of M. leidyi.
Sample Collection
Animals were collected in the wild at various locations around Woods Hole, MA either by net or by a plastic beaker attached to a pole for gently scooping the animals from the water as pictured:
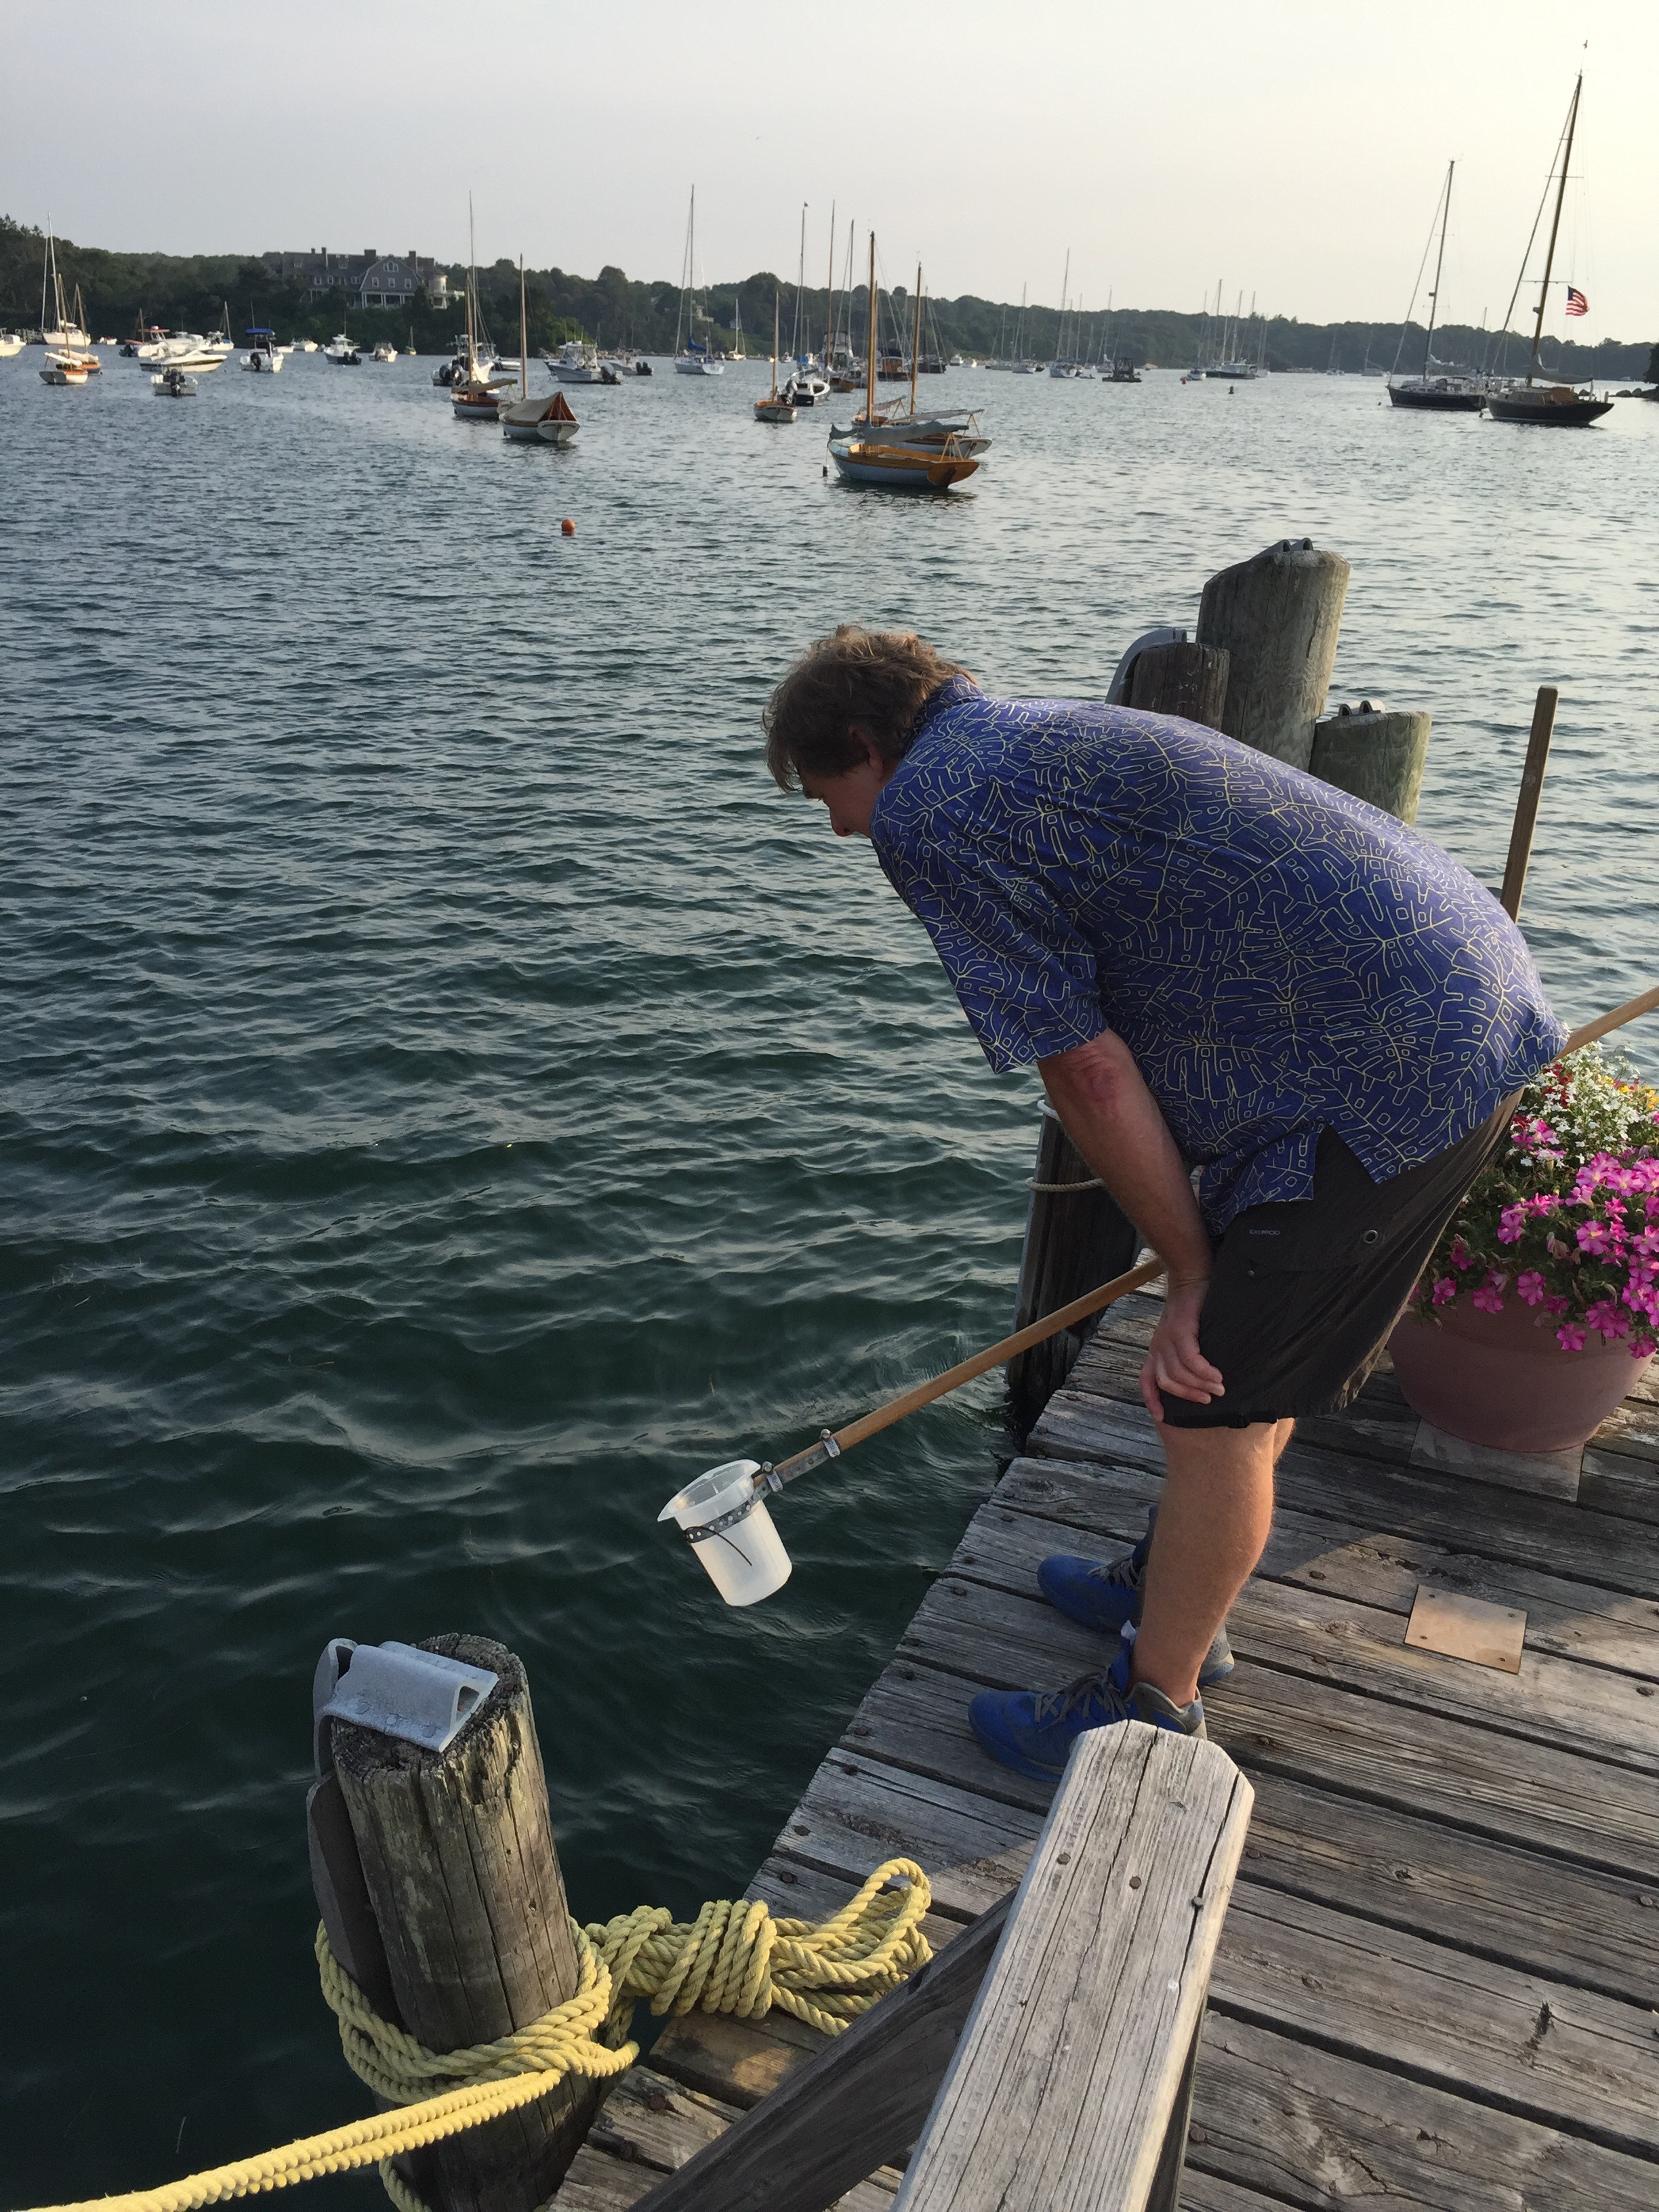
Multiple biological replicates were collected for timepoints 1, 2, 3, 4, 5, 6, 7, 8, and 9 hpf.
RNA Extraction and Assembly
Total RNA was harvested according to this protocol
mRNA was extracted from the total RNA in two parts: part 1 and part2
Library prep and sequencing was completed according to this protocol
Transcriptome assembly was performed with this protocol.
Sequence Analysis
RNA sequence reads from each developmental timepoint were aligned to the assembled transcriptome, followed by quantification and expression analysis.
FASTQ processing commands
index='/path/to/transcriptome_index'
fastq='/path/to/fastq_file'

bowtie2 -p 8 --norc -x ${index} ${fastq}  2>>alignment_report.txt | \

samtools view -@ 1 -b - | samtools sort -T ${fastq}_temp -o ${fastq}.bam -O bam -@ 1 - ;

samtools index ${fastq}.bam;

samtools idxstats ${fastq}.bam | sort -o ${fasq}.idxstats /dev/stdin
(Langmead and Salzberg 2012), (Li et al. 2009)
R Analyses
Counts for isoforms were summed to create a count per ‘gene’, which served as input to the R package DESeq2 for differential expression analysis and normalization of the read counts (Love, Huber, and Anders 2014). The following code block is a sample script for the RNA-seq analysis:
For the differential expression analysis, all timepoints were compared against the eight hour time point (8 hpf). The following samples were omitted for failing quality control tests: 7hpf_2012_N1’, ‘7hpf_2013_17’, ‘2hpf_2012_N6’, ‘1hpf_2012_N7’, ‘6hpf_2012_N2’. Additionally, all timepoints were compared against the two hour time point (2 hpf) omitting the following samples for failing quality control tests: 7hpf_2012_N1’, ‘2hpf_2012_N6’.
All heatmaps were created using the R package pheatmap (Kolde 2015).
Gene Ontology terms (“Gene Ontology Consortium: Going Forward” 2014; Ashburner et al. 2000) were assigned to each M. leidyi gene based on homologous PFAM domains and significant Swissprot blastp best hits [Camacho2009]. These terms were used to impute functional categories of differentially expressed genes.
GEO submission
Gene expression data has been deposited in the Gene Expression Omnibus (GEO) under the accession GSE93977.
Scripts
DESeq2
#!/usr/bin/env Rscript


## First list the R libraries I want to use
libraries        <- c("DESeq2", "parallel", "dplyr", 'tidyr', 'kirsten')


## Now read in the libraries
lapply(libraries, function(x){
  print(x)
  library(x, character.only = TRUE, quietly = TRUE)
})


## Create output directories


new.dirs <- c('figures', 'workspace_images', 'output')
lapply(new.dirs, function(x){
  if(!dir.exists(x)){
    dir.create(x)}})


tidyCounts <- data.table::fread("output/countsTidy.txt", data.table = FALSE)

## remove samples
tidyCounts <- tidyCounts %>% filter(!Sample %in% samplesRemove)


counts     <- tidyCounts %>% spread(key = Sample, value = Count)


WriteTable(x = counts, file = 'output/counts.txt')

normCounts <- tidyCounts %>% group_by(Sample) %>%
                             mutate(rpkm = (1e9 * as.numeric(Count))/(sum(as.numeric(Count)) * as.numeric(transcript_length))) %>%
                               mutate(rpm = (as.numeric(Count))/(sum(as.numeric(Count))/1e6)) %>%
                                  mutate(rpk = (as.numeric(Count)/(as.numeric(transcript_length)/1000))) %>%
                                      mutate(tpm = rpk/(sum(as.numeric(rpk))/1e6)) %>% ungroup() %>% select(-rpk)


rpkmOut <- normCounts %>% select(ID, transcript_length, Sample, rpkm) %>% spread(Sample, rpkm)
tpmOut  <- normCounts %>% select(ID, transcript_length, Sample, tpm) %>% spread(Sample, tpm)
rpmOut  <- normCounts %>% select(ID, transcript_length, Sample, rpm) %>% spread(Sample, rpm)


WriteTable(x = rpkmOut, file = 'output/rpkm.txt')
WriteTable(x = tpmOut, file = 'output/tpm.txt')
WriteTable(x = rpmOut, file = 'output/rpm.txt')


countsData <- data.frame(row.names = counts$ID, (counts %>% select(-ID, -transcript_length)), check.names = FALSE)

colData           <- data.table::fread("./sample_info", sep = "\t", data.table = FALSE, header = FALSE, col.names = c('condition', 'replicate'))
rownames(colData) <- colData$replicate

## remove samples

colData <- colData[-which(rownames(colData) %in% samplesRemove), ]

countsDataOrdered <- countsData[,rownames(colData)]

## run deseq on anything (for the whole PCA plot)
dds_all <- DESeqDataSetFromMatrix(countData = countsDataOrdered,
                                  colData = colData,
                                  design = ~ condition)


## run the rest of the analysis


treatment.init <- gsub(" ", "", unlist(strsplit(treatment, split = ", ")))
control.init   <- gsub(" ", "", unlist(strsplit(control, split = ", ")))

    ## Create contrasts, if there are different numbers of treatment and control, throw an error
if(length(treatment.init) == length(control.init)){
    contrast <- lapply(seq(1, length(treatment.init)), function(x){
        c(treatment.init[x], control.init[x])})
} else {
    message("\nNumber of controls does not equal number of treatments.  Exiting program")
}


dds.res <- lapply(contrast, function(x){
    x1                 <- x[1]
    x2                 <- x[2]
    small.counts.data  <- countsData[,c(grep(x1, colnames(countsData)), grep(x2, colnames(countsData)))]
    small.col.data     <- colData[c(grep(x1, rownames(colData)), grep(x2, rownames(colData))),]
    print(x)
    DESeqDataSetFromMatrix(countData = small.counts.data,
                           colData = small.col.data,
                           design = ~ condition)
})


contrast_names <- unlist(lapply(contrast, paste, collapse = "/"))
names(dds.res) <- contrast_names


dds.res <- lapply(contrast_names, function(x){
    print(x)
    dds <- dds.res[[x]]
    DESeq(dds)})

names(dds.res) <- contrast_names


## Run DESEq and extract results

all.results <- mclapply(contrast_names, function(x){
    print(x)
    dds <- dds.res[[x]]
    l <- strsplit(x, split = "/")[[1]]
    y <- data.frame(results(dds, contrast=c("condition",l[1],l[2]), tidy = TRUE))[,c('row', 'baseMean', 'log2FoldChange', 'lfcSE', 'pvalue', 'padj')]
    y_f <- gather(y, key = dea_ID, value = dea_Value, -row) %>% dplyr::rename('Gene' = row)
    y_f$contrastID <- x
    y_f
})


names(all.results) <- contrast_names


## Make a long and wide results DF

all_results_tidyDF  <- bind_rows(all.results)
all_results_DF      <- all_results_tidyDF %>% unite(ID_all, contrastID, dea_ID) %>% spread(key = ID_all, value = dea_Value)

## write them out
WriteTable(x = all_results_tidyDF, file = 'output/all_genes_expressionTidy.txt')

## create a table of significant genes with the cluster colors assigned


lfc_table <- all_results_tidyDF %>%
  mutate(significant = ifelse(dea_ID == 'padj' & dea_Value <= pval, yes = 'yes', no = 'no')) %>% # label all significant genes
  group_by(Gene) %>% mutate(num_sigGroup = length(which(significant == 'yes'))) %>% # label the # of times genes that are significant
  ungroup() %>%
  filter(num_sigGroup > 0, dea_ID == 'log2FoldChange') %>% # pull out the fold change for genes significant at least 1 time
  select(-significant, -num_sigGroup) %>% unite(colname, contrastID, dea_ID) %>% # make the table wide formatted
  spread(colname, dea_Value)


sign.table <- all_results_tidyDF  %>%
  spread(key = dea_ID, value = dea_Value)  %>%
  filter(Gene %in% lfc_table$Gene) %>%
  group_by(contrastID, Gene) %>%
  mutate(sortby = -log(padj, base = c(10))*sign(log2FoldChange)) %>%
  ungroup() %>% gather(dea_ID, dea_Value, -Gene, -contrastID) %>%
  unite(idAll, contrastID, dea_ID) %>% spread(key = idAll, value = dea_Value) %>%
  dplyr::rename('TranscriptID' = Gene)


#Make a table that contains all of the genes in the results
all.genes.table <- all_results_DF %>% dplyr::rename('TranscriptID' = Gene)


WriteTable(file = paste0("./output/significant_genes.txt"), x = sign.table)
WriteTable(file = paste0("./output/all_genes_expression.txt"), x = all.genes.table)


## make PCA info

rld     <- rlogTransformation(dds_all, blind = TRUE)
rld_all <- mclapply(dds.res, rlogTransformation, blind = TRUE)


## make heatmap inputs


## fix the log Fold Change table so it can be clustered

heatmap.input.table           <- data.frame(lfc_table)
rownames(heatmap.input.table) <- lfc_table$Gene
heatmap.input.table$Gene      <- NULL
heatmap.input.table           <- na.omit(data.matrix(heatmap.input.table))
colnames(heatmap.input.table) <- contrast_names


## Save everything we have made to Rdata files

save(file = "workspace_images/counts.Rdata", list = c('counts', 'tidyCounts', 'normCounts'))
save(file = "workspace_images/config.Rdata", list = c('title', 'workingdir', 'control', 'treatment', 'pval'))
save(file = "workspace_images/DESeq2All.Rdata", list = c('title', 'workingdir', 'pval', 'tidyCounts',
                                                         'normCounts', 'countsData', 'contrast', 'dds_all',
                                                         'all_results_tidyDF', 'all_results_DF', 'contrast_names',
                                                         'dds.res', 'rld', 'rld_all', 'heatmap.input.table'))
GO Enrichment
#!/usr/bin/env Rscript

args<-commandArgs(TRUE)
if (length(args) == 0L || any(c('-h', '--help') %in% args)) {
    message('usage: path/to/input__GO_enrich.R input1 input2 input3
    Runs GO term enrichment for a list of genes.
    Output:  A table of enrichment, either "all_go_enrichment.xls", or "go_slim_enrichment.xls"
    Args:
    input1            File with genes to be enriched, one gene per line.
    input2            Either "all_go" or "go_slim".
    input3            Optional output prefix.
    -h, --help        to print help messages')
    q('no')
}


library(topGO)
library(reshape)
library(plyr)
library(GO.db)
library(dplyr)


run.get.go.terms <- function(index, list.terms){
    # Runs get.*.GO but checks that it is runable. If the get.*.GO function is not runable, and error message is returned.
    geneList             <- factor(as.integer(GOterms$Gene %in% list.terms[[index]]))
    names(geneList)      <- GOterms$Gene
    lev <- levels(geneList)
    if(length(lev) < 2){
        message(paste0("Pvalue too stringent for ", dx[index, "contrasts"], ". Choose a higher pvalue to yield results for this contrast."))
    } else {
        terms <- get.GOterms(geneList[[index]], 10, c("MF", "CC", "BP"))
        invisible(terms)
    }
}

get.bh <- function(go.id, df){
    # Returns the benjamini-hochberg correction so it can later be appended to the final GOterms.
    #
    # Args:
    #   go.id: a go.id to find the benjamini-hochberg correction for.
    #   df: the data.frame holding the bh correction values.
    bh     <- grep(go.id, rownames(df))
    bh.val <- df[bh, "BH.correction"]
    invisible(bh.val)
}


create.file <- function(enriched.terms, name){
    # Creats a file holding the casted table.
    #
    # Args:
    #   prefix: a string of what should be the file identifier.
    #   casted.data: a resultant table from the function "cast.table".
    file.create(name)
    zz   <- file(name, "w")
    write.table(enriched.terms, file=zz, sep = "\t", col.names=TRUE, row.names=FALSE, quote=FALSE)
    close(zz)
}


Get.go.terms <- function(GOterms, list.terms, ontol, xx){
    # Runs the base line GO term analysis as provided through topGO.
    ## contrast             <- dx[index,"contrasts"]
    #terms                <- list.terms[[index]]
    #genes                <- table[terms, "_id"]
    geneList             <- factor(as.integer(GOterms$id %in% list.terms))
    names(geneList)      <- GOterms$id
    #contrast <- dx[index,"contrasts"]
    #geneList <- geneList[[index]]
    GO                   <- new("topGOdata", ontology=ontol, allGenes=geneList, annot = annFUN.gene2GO, gene2GO = readmap)
    resultFisher         <- runTest(GO, algorithm = "classic", statistic = "fisher")
    pVal                 <- data.frame(pval=signif(score(resultFisher), 6),BH.correction=seq(1, length(score(resultFisher))))
    pVal                 <- pVal[order(pVal$pval),]
    pVal$BH.correction   <- signif(p.adjust(pVal$pval, method="BH"), 6)
    pVal.sub             <- pVal[pVal$BH.correction<0.01,]
    pVal.sub$go_id       <- rownames(pVal.sub)
    pVal.try <- cbind(pVal.sub, Term=sapply(pVal.sub$go_id, FUN=function(n){Term(xx[[n]])}), Ontol=sapply(pVal.sub$go_id, FUN=function(n){Ontology(xx[[n]])}))
    if (nrow(pVal.try) >0){
        df2                  <- pVal.try[,c("go_id", "Term", "Ontol", "pval", "BH.correction")]
        out <- list(df2, GO, resultFisher)
        invisible(out)
} else {
    message("No enrichment")
}
}

retrieve.my.genes <- function(final, readmap.inverse, terms){
    ## retrieve the genes for the GO terms that are in the readmapping file
    ## final: the final df to add the genes to.
    ## readmap.inverse: the readmapping to find the genes in
    ## terms: the list of GO terms
    ids     <- unlist(lapply(final$go_id, toString))
    a.small <- readmap.inverse[ids]
    my.terms <- lapply(a.small, function(x){
        new.terms <- na.omit(match(x, terms))
        b         <- terms[new.terms]
        invisible(b)}
                       )
    invisible(my.terms)
}

lookup.zeros <- function(off.gos, all.readmap){
    ## lookup genes present in the analysis for the offspring terms
    ##      off.gos: GO terms with zero  genes associated
    ##      all.readmap: the map of transcripts to GO terms for the analysis

    resul <- na.omit(lapply(off.gos, function(x){all.readmap[[x]]}))
    names(resul) <- names(off.gos)
    invisible(resul)
}


get.parent.length <- function(zeros.dx, Ontol){
    ## return the  genes associated with a parent GO term
    ##     zeros.dx: dataframe of the parent GO terms with zero values
    ##     Ontol: One of either "CC", "MF", "BP"
    require(GO.db)
    require(dplyr)
    if (nrow(zeros.dx) < 1){
        message(paste0(Ontol, " has no zero gene length terms for this analysis"))
    } else {
        if(Ontol == "CC"){## initialize ontology hierarchies
            ontol.off <- as.list(GOCCOFFSPRING)
        }
        if (Ontol == "BP"){
            ontol.off <- as.list(GOBPOFFSPRING)
        }
        if(Ontol == "MF"){
            ontol.off <- as.list(GOMFOFFSPRING)
        }
        ## lookup the offspring GO terms
        ontol.zero.off   <- unlist2(lapply(zeros.dx$go_id, function(x){ontol.off[x]}))
        ## lookup  genes for the offspring terms
        ontol.       <- lookup.zeros(ontol.zero.off, readmap.inverse)
        ## pull out unique names of the GO terms
        ontol.names.uniq <- unique(names(ontol.))
        ## pull out the number of  genes associated with the parent GO terms
        ontol.ids.genes        <- lapply(ontol.names.uniq, function(x){unique(unlist(ontol.[grep(x, names(ontol.))]))})
        ontol.ids.len          <- unlist2(lapply(ontol.ids.genes, length))
        Genes                  <- unlist2(lapply(ontol.ids.genes, paste, collapse=", "))
        dff                    <- data.frame(GO=ontol.names.uniq, Length=ontol.ids.len, Genes=Genes, stringsAsFactors=FALSE)
        zeros.dx               <- zeros.dx[order(zeros.dx$go_id), ]
        dff                    <- dff[order(dff$GO), ]
        zeros.dx$Branch_Num_Genes     <- dff$Length
        zeros.dx$Branch_Genes         <- dff$Genes
        invisible(zeros.dx)
    }
}

create.hierarchy <- function(go.results, go.df, ontol, go.terms, out){
    if (nrow(go.df) == 0){
        message(paste0('Hierarchy for ', ontol, " cannot be assigned."))
    } else {
        ## creates ontology hierarchy
        pvals <- go.df$BH.correction
        names(pvals) <- rownames(go.df)
        if (length(pvals) > 50){
            numNodes <- 50
        } else {
            numNodes <- length(pvals)
        }
        pdf(file=paste0(out, "/", go.terms, "_", ontol, "_hierarchy.pdf"), width=10, height=10)
        showSigOfNodes(go.results, pvals, firstSigNodes = numNodes, useInfo = "all")
        dev.off()
    }
}


##args <- c("genes.txt", "all_go")
if(length(args) == 3){
    outfile <- paste0(args[3], "_", args[2], "_enrichment.xls")
} else {
    outfile <- paste0(args[2], "_enrichment.xls")
}


if(args[2] == "all_go"){
    GOterms <- read.table("gene2go.txt", quote="", stringsAsFactors=FALSE, sep="\t", header=TRUE)
    colnames(GOterms) <- c("id", "term")
    readmap           <- readMappings("gene2go.txt", sep = "\t", IDsep = ";")
}


terms <- scan(args[1], "character")


## read in the entire gene2allGo annotation and only keep the terms that are present in the chosen significant genes.
all.readmap <- readMappings("gene2go.txt", sep = "\t", IDsep = ";")
all.readmap <- all.readmap[terms]
readmap.inverse    <- inverseList(all.readmap)


## access the GO ontology hierarchy
xx <- as.list(GOTERM)


## run the enrichment analysis
bp <- Get.go.terms(GOterms, terms, "BP", xx)
cc <- Get.go.terms(GOterms, terms, "CC", xx)
mf <- Get.go.terms(GOterms, terms, "MF", xx)

bp.df <- bp[[1]]
mf.df <- mf[[1]]
cc.df <- cc[[1]]

bp.go <- bp[[2]]
mf.go <- mf[[2]]
cc.go <- cc[[2]]

bp.fish <- bp[[3]]
mf.fish <- mf[[3]]
cc.fish <- cc[[3]]


## bring to together all of the enrichments
final           <- rbind(mf.df, cc.df, bp.df)
rownames(final) <- NULL


## get the  genes associated with the enrichment and attach them to the enrichment data.frame
my.genes        <- retrieve.my.genes(final, readmap.inverse, terms)
my.genes        <- lapply(my.genes, unique)
len.my.genes    <- lapply(my.genes, length)
my.genes        <- lapply(my.genes, toString)
final$Num_Genes <- unlist(len.my.genes)
final$Genes     <- unlist(my.genes)


all.my.genes        <- readmap.inverse[final$go_id]
all.my.genes        <- lapply(all.my.genes, unique)
len.all.my.genes    <- lapply(all.my.genes, length)
all.my.genes        <- lapply(all.my.genes, toString)
final$Num_Leaf_Genes <- unlist(len.all.my.genes)
final$Leaf_Genes     <- unlist(all.my.genes)


## first filter the final df of the zero values for parent genes to be added back later

final.t                        <- filter(final, Num_Genes != 0)
final.t$Branch_Num_Genes     <- NA
final.t$Branch_Genes         <- NA


## next filter out any parent terms that have zero  Genes currently annotated
zero <- filter(final, Num_Genes == 0)


## initialize ontologies for parent GO terms that are not annotated to  genes
zero.cc <- filter(zero, Ontol == "CC")
zero.bp <- filter(zero, Ontol == "BP")
zero.mf <- filter(zero, Ontol == "MF")


## find the number of  genes associated with the parent ID
cc.final <- get.parent.length(zero.cc, "CC")
bp.final <- get.parent.length(zero.bp, "BP")
mf.final <- get.parent.length(zero.mf, "MF")


## Bind together everything and write out the final table
final.done <- rbind(final.t, cc.final, bp.final, mf.final)


if (nrow(final.done)>0){
    create.file(final.done, outfile)
} else {
    message("No enrichment")
}


## create.hierarchy(cc.go, cc.df, "CC", args[2], out.dir)
## create.hierarchy(mf.go, mf.df, "MF", args[2], out.dir)
## create.hierarchy(bp.go, bp.df, "BP", args[2], out.dir)

save.image(file = paste0(args[2], ".Rdata"))
References
Ashburner, Michael, Catherine A. Ball, Judith A. Blake, David Botstein, Heather Butler, J. Michael Cherry, Allan P. Davis, et al. 2000. “Gene Ontology: Tool for the Unification of Biology.” Nature Genetics 25 (1). Springer Nature: 25–29. doi:10.1038/75556.
“Gene Ontology Consortium: Going Forward.” 2014. Nucleic Acids Research 43 (D1). Oxford University Press (OUP): D1049–D1056. doi:10.1093/nar/gku1179.
Kolde, R. 2015. “Pheatmap: Pretty Heatmaps. R Package Version 1.0. 2.”
Langmead, Ben, and Steven L Salzberg. 2012. “Fast Gapped-Read Alignment with Bowtie 2.” Nature Methods 9 (4). Springer Nature: 357–59. doi:10.1038/nmeth.1923.
Li, H., B. Handsaker, A. Wysoker, T. Fennell, J. Ruan, N. Homer, G. Marth, G. Abecasis, and R. Durbin and. 2009. “The Sequence Alignment/Map Format and SAMtools.” Bioinformatics 25 (16). Oxford University Press (OUP): 2078–9. doi:10.1093/bioinformatics/btp352.
Love, Michael I, Wolfgang Huber, and Simon Anders. 2014. “Moderated Estimation of Fold Change and Dispersion for RNA-Seq Data with DESeq2.” Genome Biology 15 (12). Springer Nature. doi:10.1186/s13059-014-0550-8.
![]()

![]()